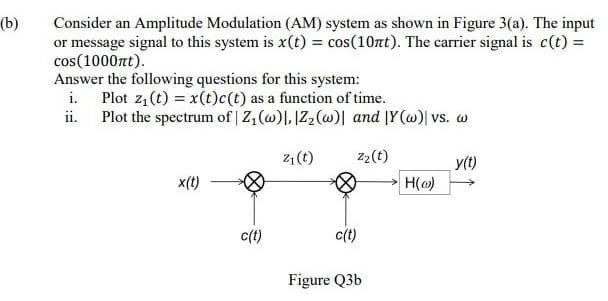
(b) Consider an Amplitude Modulation (AM) system as shown in Figure 3(a). The input or message signal to this system is x(t) = cos(10πt). The carrier signal is c(t) = cos(1000πt). Answer the following questions for this system: i. Plot z1(t) = x(t)c(t) as a function of time. ii. Plot the spectrum of |Z1(ω)|, |Z2(ω)| and |Y(ω)| vs. ω Figure Q3b

![The following figure shows a switching modulator. Assume the lowpass message signal m(t) has bandwidth 3000 Hz and max|m(t)| = 0.2. The carrier signal is c(t) = cos(2π15000 t). x(t) = m(t)+c(t). After the diode, the signal y(t) is periodic and thus its Fourier series representation is y(t) = x(t)[12+2πcos(2π15000 t)−23πcos(2π3×15000 t)+25πcos(2π5×15000 t)−⋯]. (1) With an appropriate bandpass filter BPF, this modulator can conduct AM modulation. Please determine the magnitude spectrum of the ideal BPF (e. g. , determine its center frequency and bandwidth). Find the output AM signal waveform expression s(t) and its percentage modulation. (2) Can it work as a DSB-SC modulator? If yes, please also find the appropriate magnitude spectrum of the ideal BPF and find the output DSB-SC signal waveform expression s(t).](https://www.doubtrix.com/uploads/editor/1706063044cSWEkzuDjS.jpeg)