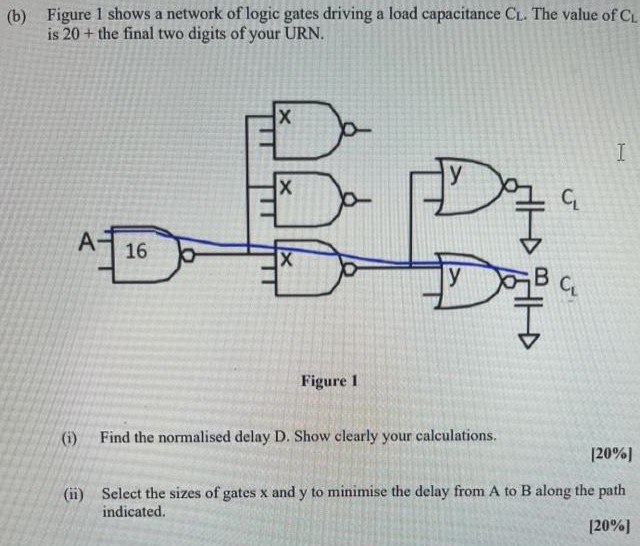
Figure 1 shows a network of logic gates driving a load capacitance CL. The value of CL is 20+ the final two digits of your URN. (i) Find the normalised delay D. Show clearly your calculations. (ii) Select the sizes of gates x and y to minimise the delay from A to B along the path indicated.