Figure 3-1 shows a MOSFET test circuit used to generate the curve shown below. The data was taken by varying vGS and measuring the MOSFET turn-on resistance rDS with an ohmmeter. MOSFET Turn on Resistance a) Using this data, determine values for the MOSFET parameters kn
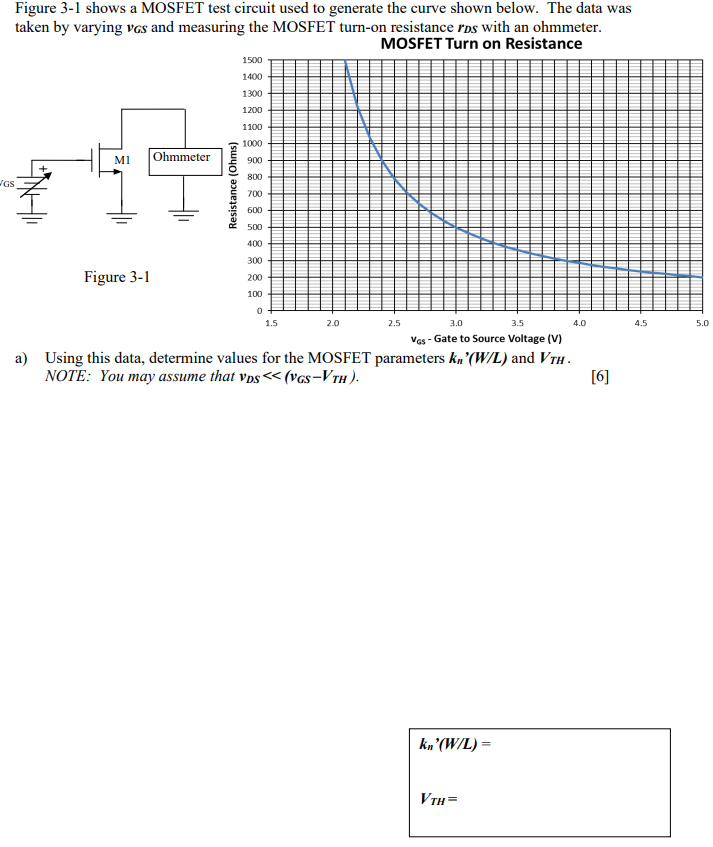
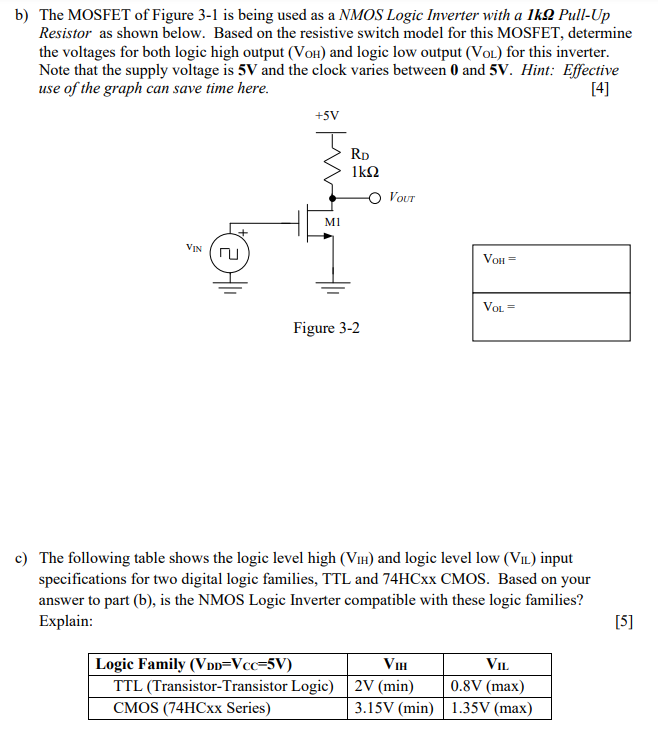
Figure 3-1 shows a MOSFET test circuit used to generate the curve shown below. The data was taken by varying vGS and measuring the MOSFET turn-on resistance rDS with an ohmmeter. MOSFET Turn on Resistance a) Using this data, determine values for the MOSFET parameters kn
Figure 3-1 shows a MOSFET test circuit used to generate the curve shown below. The data was taken by varying vGS and measuring the MOSFET turn-on resistance rDS with an ohmmeter. MOSFET Turn on Resistance a) Using this data, determine values for the MOSFET parameters kn

Image text
Figure 3-1 shows a MOSFET test circuit used to generate the curve shown below. The data was taken by varying vGS and measuring the MOSFET turn-on resistance rDS with an ohmmeter. MOSFET Turn on Resistance a) Using this data, determine values for the MOSFET parameters kn

Detailed Answer

Answer
  • Student Reviews:
  • (1)
  • Correct answers (1)
  • Complete solution (1)
  • Step-by-step solution (1)
  • Fully explained (1)