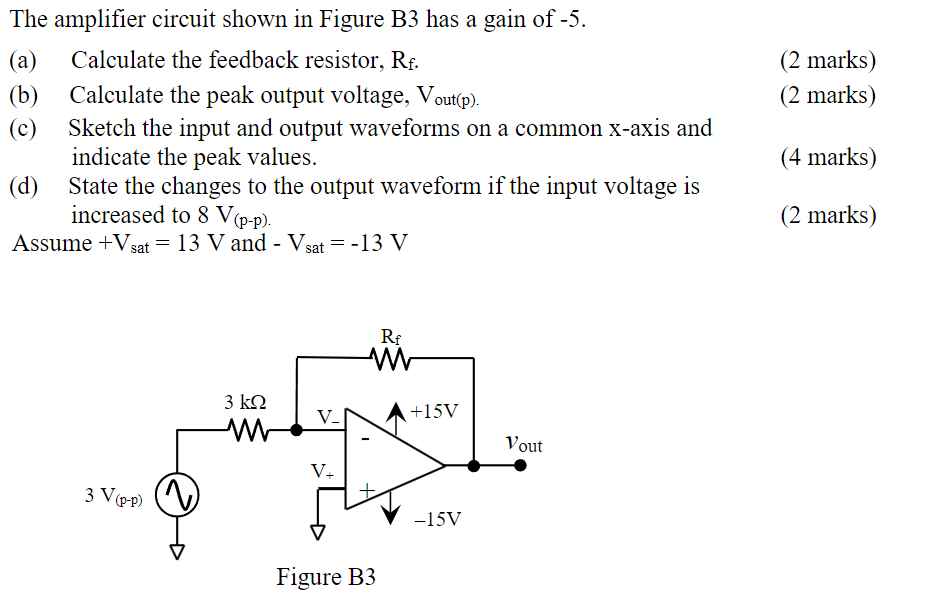
The amplifier circuit shown in Figure B3 has a gain of -5. (a) Calculate the feedback resistor, Rf. (2 marks) (b) Calculate the peak output voltage, Vout(p). (2 marks) (c) Sketch the input and output waveforms on a common x-axis and indicate the peak values. (4 marks) (d) State the changes to the output waveform if the input voltage is increased to 8 V(p−p). (2 marks) Assume +Vsat = 13 V and −Vsat = −13 V Figure B3