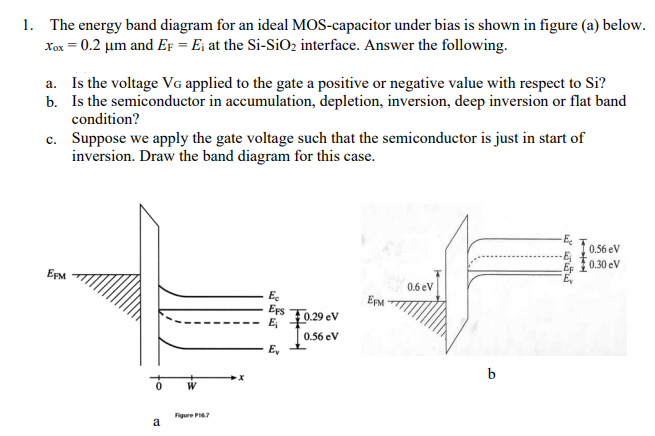
The energy band diagram for an ideal MOS-capacitor under bias is shown in figure (a) below. a. Is the voltage VG applied to the gate a positive or negative value with respect to Si? b. Is the semiconductor in accumulation, depletion, inversion, deep inversion or flat band condition? c. Suppose we apply the gate voltage such that the semiconductor is just in start of inversion. Draw the band diagram for this case.

![A MOS capacitor is made from Si. When VG is applied to the gate of the capacitor, the band diagram looks as shown below. Answer the questions that follow. (a) Is the applied gate voltage VG positive or negative? Explain. (b) Is the semiconductor p-type or n-type? What is the doping concentration? (c) Calculate the number of electrons and holes in the bulk of the semiconductor. (d) Calculate the number of electrons and holes near the surface of the semiconductor. (e) Is the semiconductor under depletion, inversion or in flat-band condition? (f) If we define the electrostatic potential, φ(x) = (1 /q) [Ei(bulk) − Ei(x)], plot φ(x) versus x. (g) Plot the charge density as a function of x. Identify in your plot which are mobile charges and which are ionized donors or acceptors.](https://www.doubtrix.com/uploads/editor/6969718029XlgEeYoZyk.png)