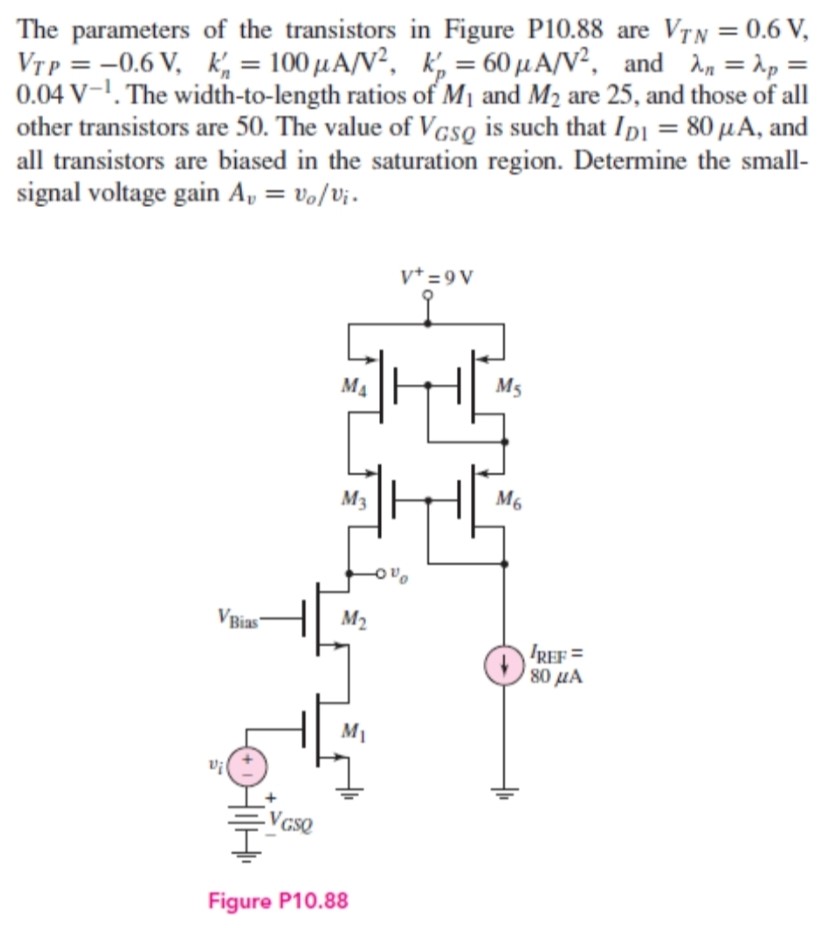
The parameters of the transistors in Figure P10.88 are VTN = 0.6 V, VTP = −0.6 V, kn′ = 100 μA/V2, kp′ = 60 μA/V2, and λn = λp = 0.04 V−1. The width-to-length ratios of M1 and M2 are 25, and those of all other transistors are 50. The value of VGSQ is such that ID1 = 80 μA, and all transistors are biased in the saturation region. Determine the smallsignal voltage gain Av = vo/vi. Figure P10.88

![(b) For a MOSFET current source shown in Figure 5 the circuit parameters are: V+ = 3 V and V − = −3 V. Transistor parameters for NMOS are: VTN = 0.7 V, kn′ = 200 μA/V2 and λn = 0.01 V−1; and the transistor parameters for PMOS are: VTP = −0.6 V, kp′ = 80 μA/V2 and λp = 0.03 V−1. The transistor aspect ratios are: (W/L)1 = 10, (W/L)2 = 35, (W/L)3 = 5 and (W/L)4 = 15. Find IO, IREF and the VGS voltages for all transistors if the minimum voltage at the drain of transistor M2, i.e. VD2 is −2.3 V. [12 Marks] Figure 5](https://www.doubtrix.com/uploads/editor/2283158972ZKWioHWPli.jpg)