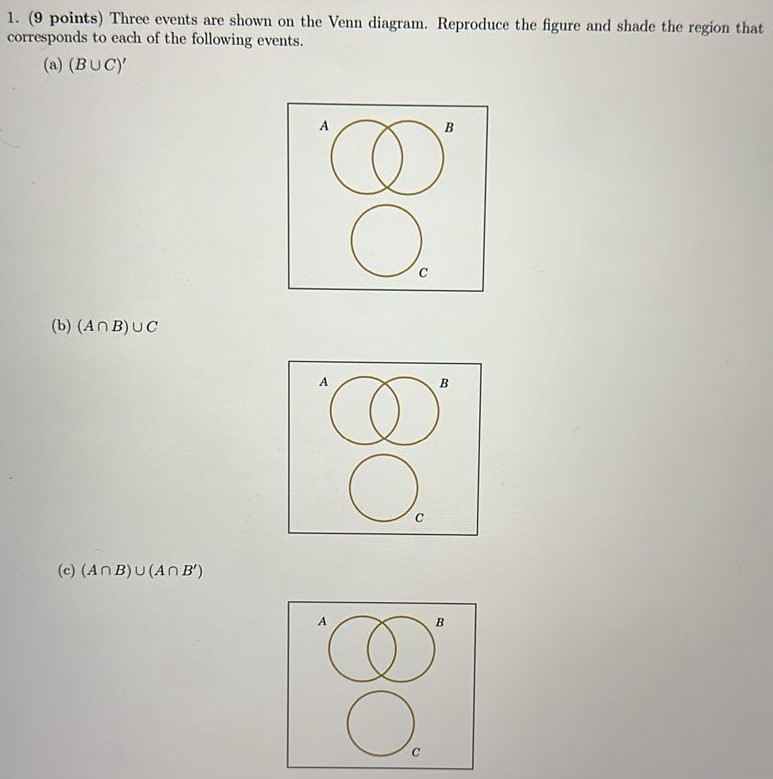
1. (9 points) Three events are shown on the Venn diagram. Reproduce the figure and shade the region that corresponds to each of the following events. (a) (B ∪ C)’ (b) (A ∩ B) ∪ C (c) (A ∩ B) ∪ (A ∩ B’)

A Venn diagram is a graphical representation to show the relationships between multiple sets. It shows how distinct sets differ or share elements by using overlapping circles or other shapes. In Venn diagram, each circle represents a set, and the components that are shared by both sets are represented by the overlapping portions.
The basic or key components used to make Venn diagram are:
Sets: In the Venn diagram, every circle represents a set and items or numbers in a set are called as elements.
Universal set: The set of all elements from each is represented by a rectangle, enclosing all of the circles.
Overlap: The elements shared by two or more sets are shown by the overlapped area of the corresponding circles and marked by some colour.
Non-overlapping regions: The elements which are not shared by sets are represented by the portions of each circle and are not marked by any colour.


You'll get a detailed, step-by-step and expert verified solution.
 Work With Experts to Reach at Correct Answers