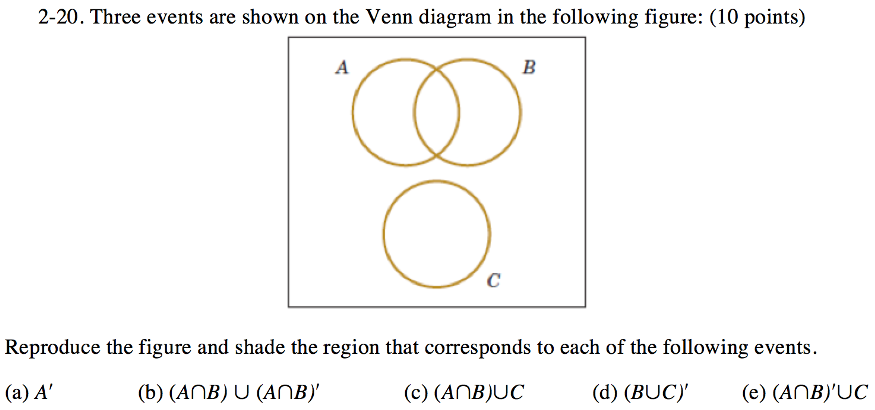
2-20. Three events are shown on the Venn diagram in the following figure: (10 points) Reproduce the figure and shade the region that corresponds to each of the following events. (a) A’ (b) (A∩B) ∪ (A∩B)’ (c) (A∩B)∪C (d) (B∪C)’ (e) (A∩B)’∪C

A Venn diagram is a visual representation to show the logical relationship between sets and their elements. In Venn diagram, sets are generally represented by circles and uses overlapping and non-overlapping circles. Union and intersection operations are used to relate sets. A ∪ B is A union B i.e. elements belongs to this set contains elements from both set A and set B. A ∩ B is A intersection B i.e. elements will be common elements from both sets A and B.


You'll get a detailed, step-by-step and expert verified solution.
 Work With Experts to Reach at Correct Answers