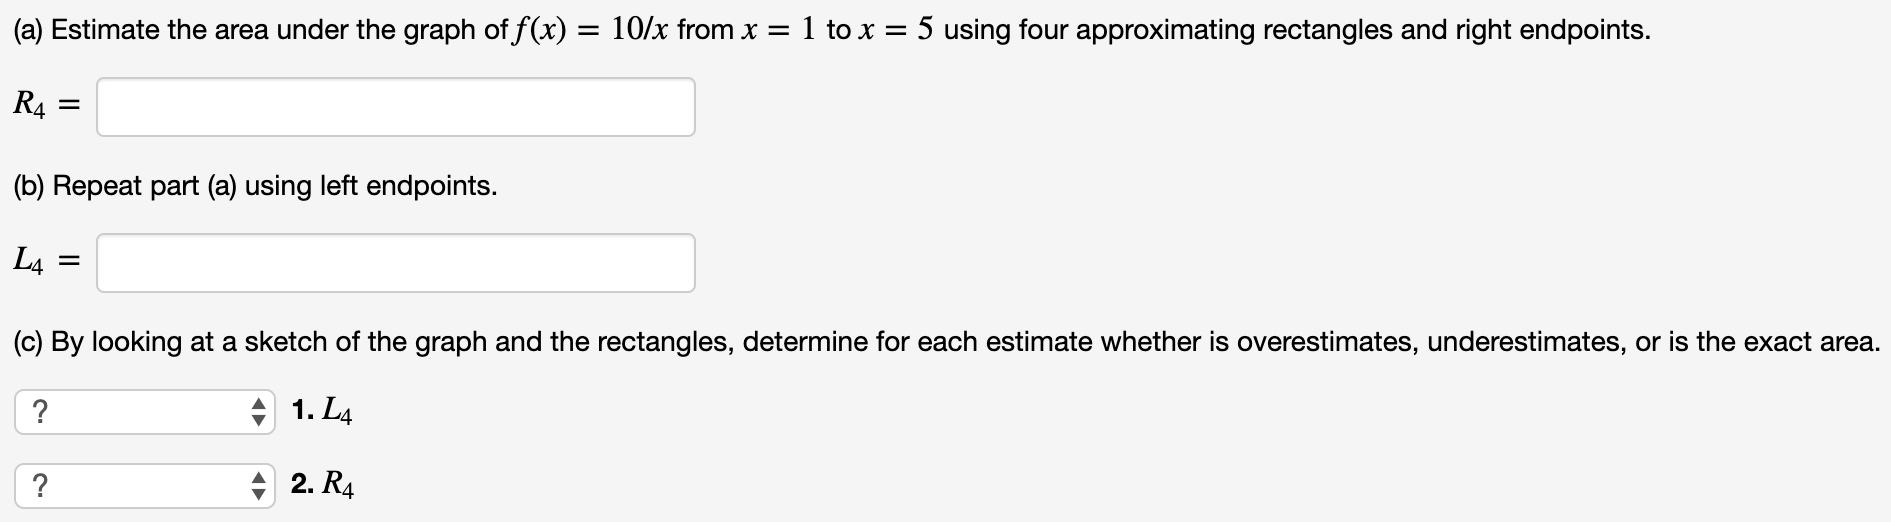
(a) Estimate the area under the graph of f(x) = 10/x from x = 1 to x = 5 using four approximating rectangles and right endpoints. R4 = (b) Repeat part (a) using left endpoints. L4 = (c) By looking at a sketch of the graph and the rectangles, determine for each estimate whether is overestimates, underestimates, or is the exact area. 1. L4 2. R4