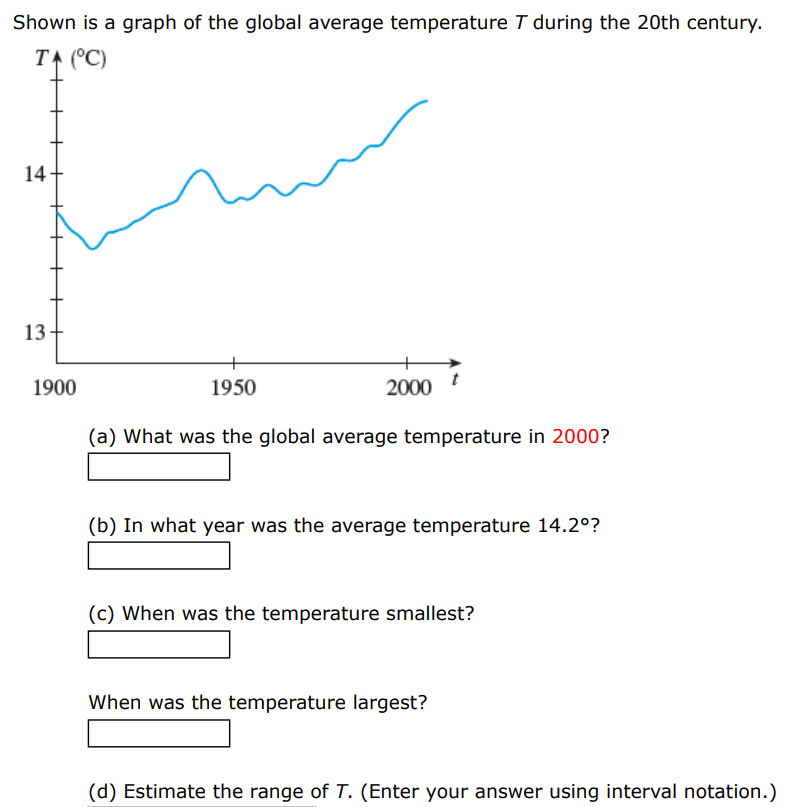
Shown is a graph of the global average temperature T during the 20th century. (a) What was the global average temperature in 2000? (b) In what year was the average temperature 14.2∘? (c) When was the temperature smallest? When was the temperature largest? (d) Estimate the range of T. (Enter your answer using interval notation.)