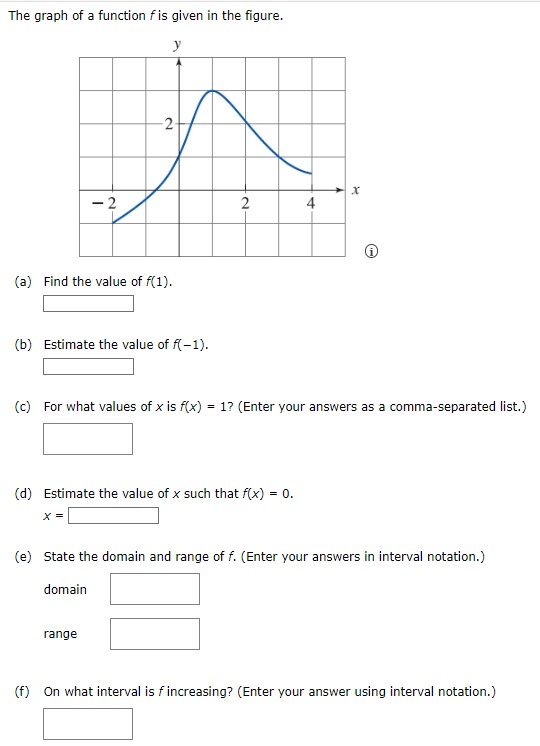
The graph of a function f is given in the figure. (a) Find the value of f(1). (b) Estimate the value of f(−1). (c) For what values of x is f(x) = 1 ? (Enter your answers as a comma-separated list.) (d) Estimate the value of x such that f(x) = 0. x = (e) State the domain and range of f. (Enter your answers in interval notation.) domain range (f) On what interval is f increasing? (Enter your answer using interval notation.)
