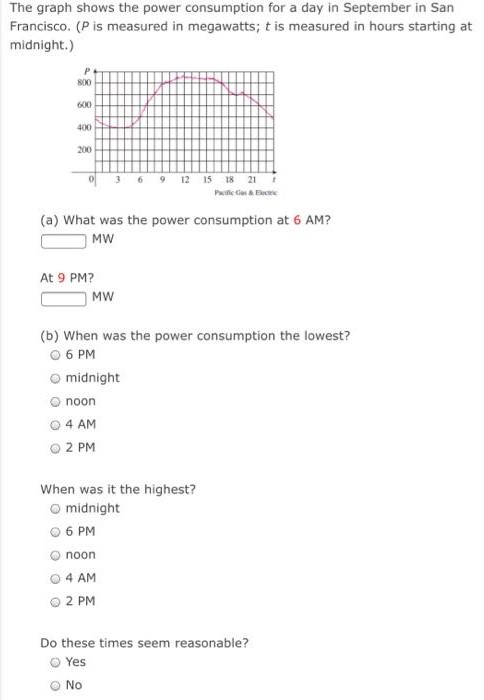
The graph shows the power consumption for a day in September in San Francisco. (P is measured in megawatts; t is measured in hours starting at midnight.) (a) What was the power consumption at 6 AM? MW At 9 PM? MW (b) When was the power consumption the lowest? 6 PM midnight noon 4 AM 2 PM When was it the highest? midnight 6 PM noon 4 AM 2 PM Do these times seem reasonable? Yes No