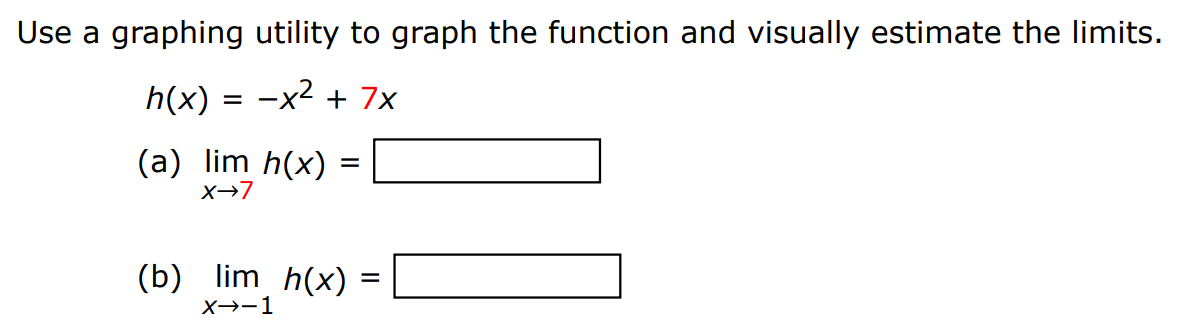
Use a graphing utility to graph the function and visually estimate the limits. h(x) = −x2 + 7x (a) limx→7 h(x) = (b) limx→−1 h(x) = Read more Read less
Click on Notify me to get email when question is answered.