A graph of position versus time for a certain particle moving along the x-axis is shown in the figure below. Find the average velocity in the following time intervals. (a) 0 to 2.00 s m/s (b) 0 to 4.00 s m/s (c) 2.00 s to 4.00 s m/s (d) 4.00 s to 7.00 s m/s (e) 0 to 8.00 s m/s
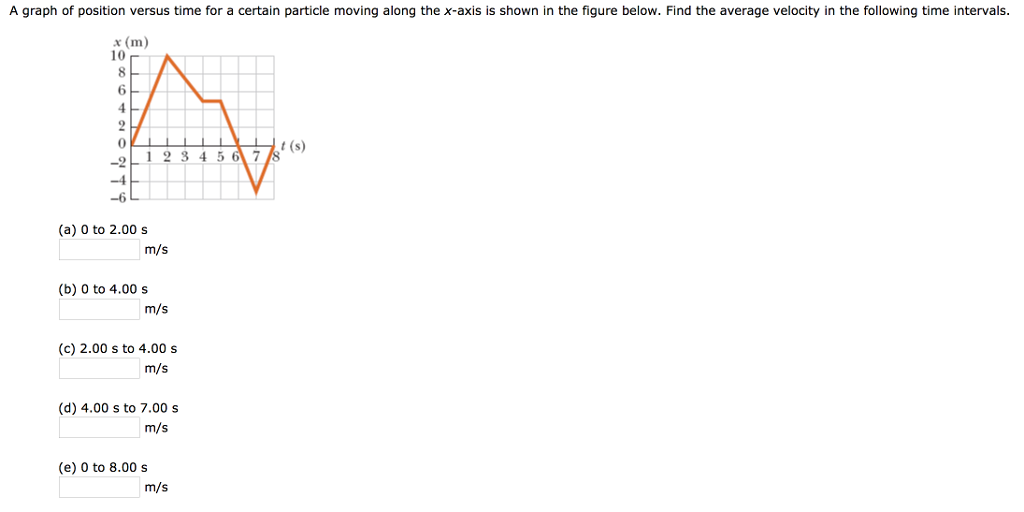
A graph of position versus time for a certain particle moving along the x-axis is shown in the figure below. Find the average velocity in the following time intervals. (a) 0 to 2.00 s m/s (b) 0 to 4.00 s m/s (c) 2.00 s to 4.00 s m/s (d) 4.00 s to 7.00 s m/s (e) 0 to 8.00 s m/s

Image text
A graph of position versus time for a certain particle moving along the x -axis is shown in the figure below. Find the average velocity in the following time intervals. (a) 0 to 2.00 s m / s (b) 0 to 4.00 s m / s (c) 2.00 s to 4.00 s m / s (d) 4.00 s to 7.00 s m / s (e) 0 to 8.00 s m / s

Detailed Answer

Answer
  • Student Reviews:
  • (3)
  • Correct answers (3)
  • Complete solution (3)
  • Step-by-step solution (3)
  • Fully explained (3)