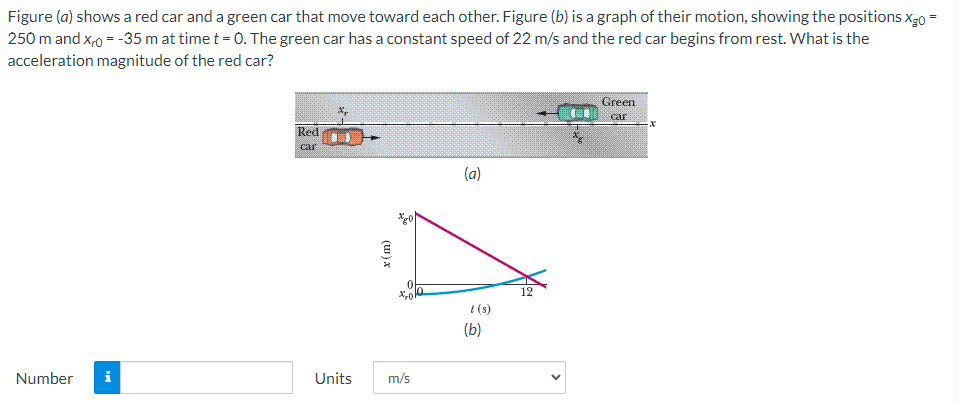
Figure (a) shows a red car and a green car that move toward each other. Figure (b) is a graph of their motion, showing the positions xg0 = 250 m and xr0 = −35 m at time t = 0. The green car has a constant speed of 22 m/s and the red car begins from rest. What is the acceleration magnitude of the red car? (a) (b) Number Units m/s