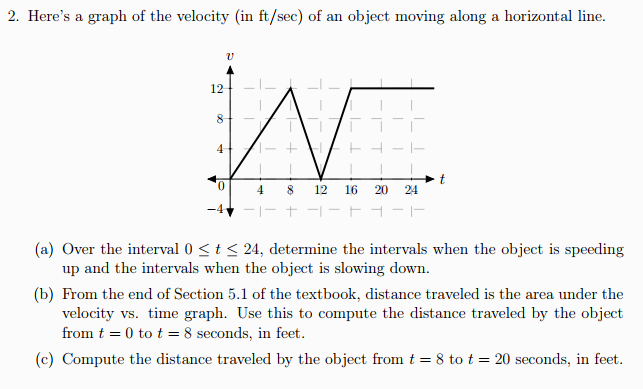
Here's a graph of the velocity (in ft/sec) of an object moving along a horizontal line. (a) Over the interval 0 ≤ t ≤ 24, determine the intervals when the object is speeding up and the intervals when the object is slowing down. (b) From the end of Section 5.1 of the textbook, distance traveled is the area under the velocity vs. time graph. Use this to compute the distance traveled by the object from t = 0 to t = 8 seconds, in feet. (c) Compute the distance traveled by the object from t = 8 to t = 20 seconds, in feet.