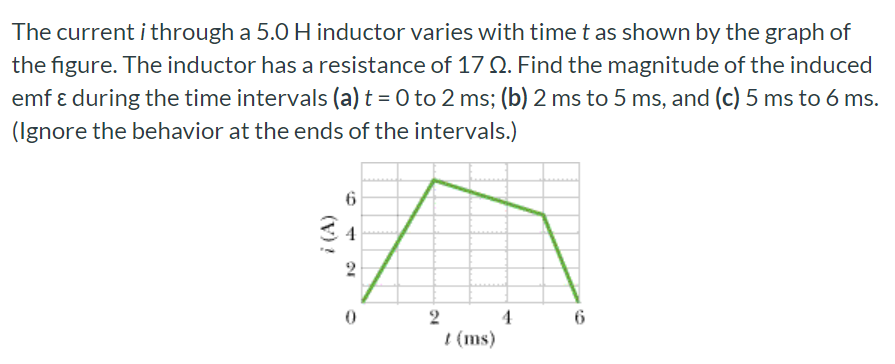
The current i through a 5.0 H inductor varies with time t as shown by the graph of the figure. The inductor has a resistance of 17 Ω. Find the magnitude of the induced emf ε during the time intervals (a) t = 0 to 2 ms; (b) 2 ms to 5 ms, and (c) 5 ms to 6 ms. (Ignore the behavior at the ends of the intervals.)