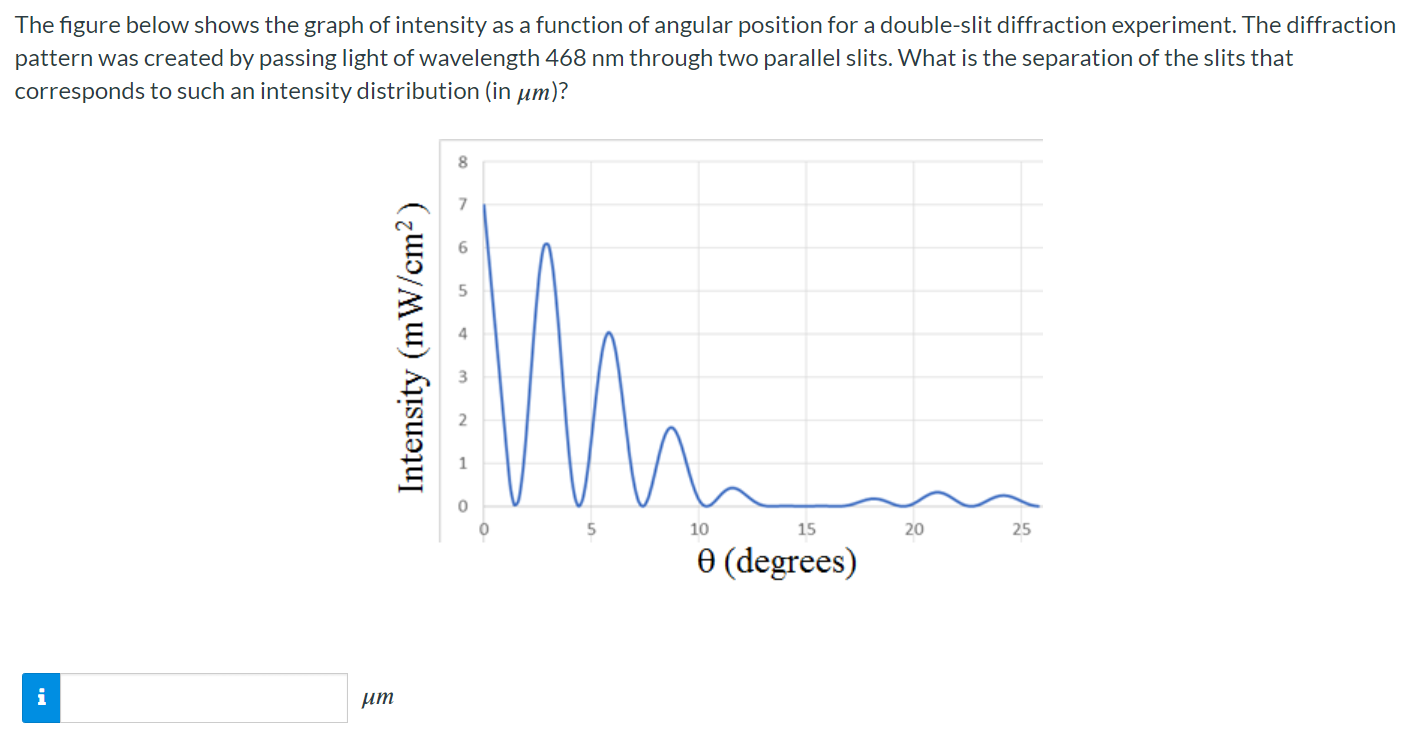
The figure below shows the graph of intensity as a function of angular position for a double-slit diffraction experiment. The diffraction pattern was created by passing light of wavelength 468 nm through two parallel slits. What is the separation of the slits that corresponds to such an intensity distribution (in μm)? μm