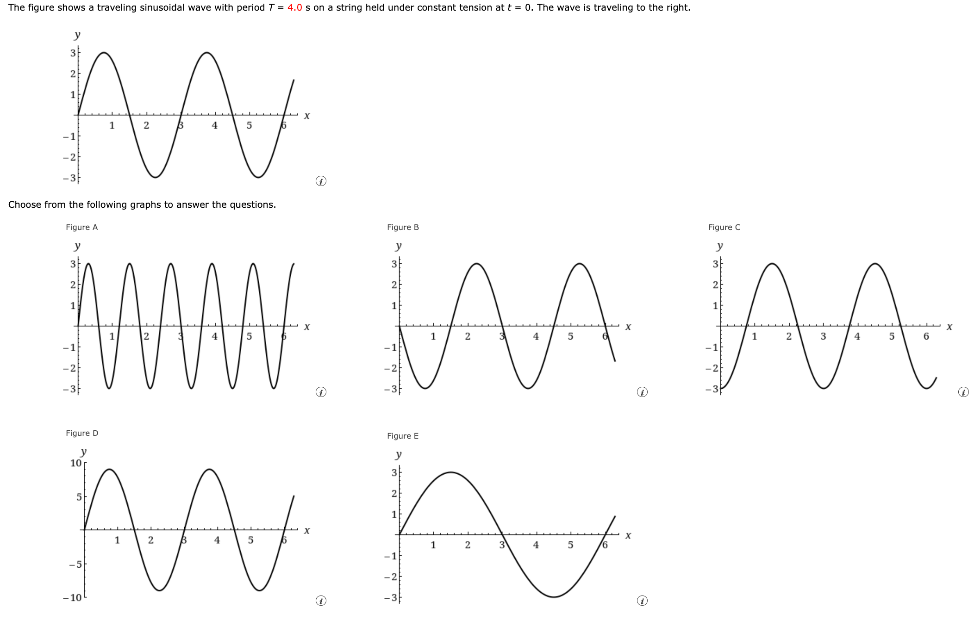
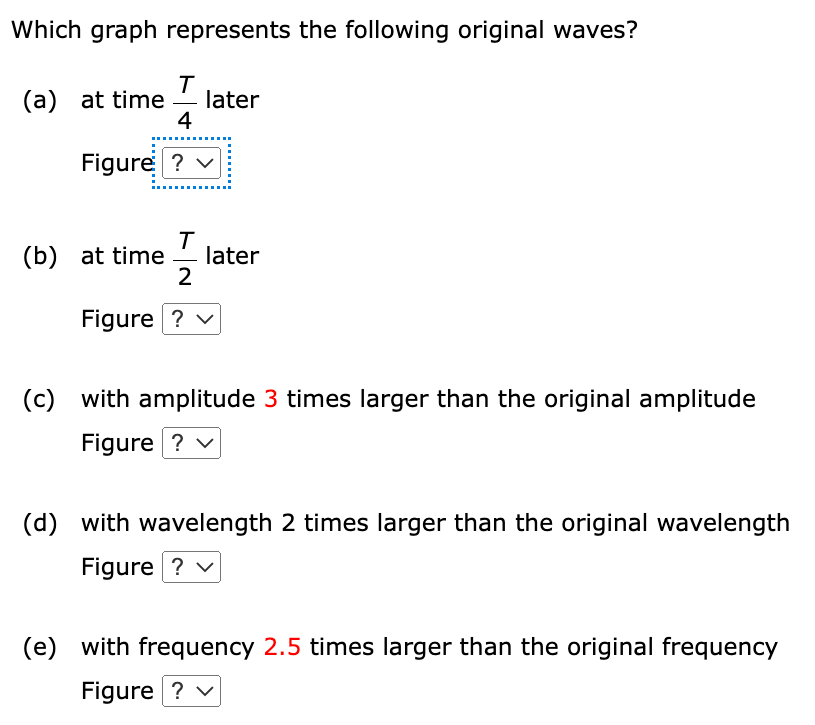
The figure shows a traveling sinusoidal wave with period T = 4.0 s on a string held under constant tension at t = 0. The wave is traveling to the right. Choose from the following graphs to answer the questions. Figure A Figure B Figure C Figure D Figure E Which graph represents the following original waves? (a) at time T4 later Figure (b) at time T2 later Figure (c) with amplitude 3 times larger than the original amplitude Figure (d) with wavelength 2 times larger than the original wavelength Figure (e) with frequency 2.5 times larger than the original frequency Figure