The following is a graph of an object's velocity over time. a) What is the total displacement of the object between t = 0.0 s and t = 2.0 s? b) At what times, if any, does the golf cart change directions? How can you tell? c) What is the maximum displacement the object reaches from its starting point? At what time does it reach this displacement? d) Draw an acceleration vs time graph for the object over the same time interval. Include numbers and labels on your axes.
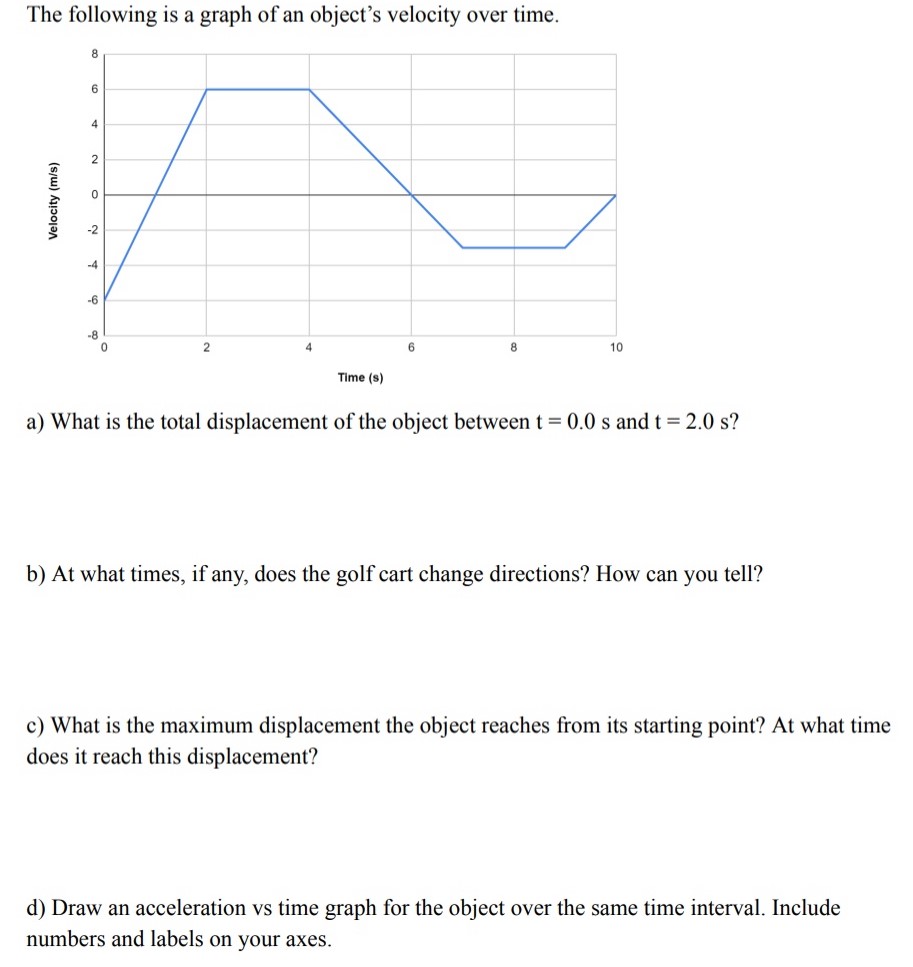
The following is a graph of an object's velocity over time. a) What is the total displacement of the object between t = 0.0 s and t = 2.0 s? b) At what times, if any, does the golf cart change directions? How can you tell? c) What is the maximum displacement the object reaches from its starting point? At what time does it reach this displacement? d) Draw an acceleration vs time graph for the object over the same time interval. Include numbers and labels on your axes.

Image text
The following is a graph of an object's velocity over time. a) What is the total displacement of the object between t = 0.0 s and t = 2.0 s ? b) At what times, if any, does the golf cart change directions? How can you tell? c) What is the maximum displacement the object reaches from its starting point? At what time does it reach this displacement? d) Draw an acceleration vs time graph for the object over the same time interval. Include numbers and labels on your axes.

Detailed Answer