The graph of the velocity (in km/h) of a car that is accelerating is shown in the figure, where t is measured in seconds. (a) Use the midpoint rule with n = 3 to estimate the average velocity vave (in km/h) of the car during the first 12 seconds. vave = km/h (b) At what time t (in s) was the instantaneous velocity equal to the average velocity? (Round your answer to one decimal place.) t = s
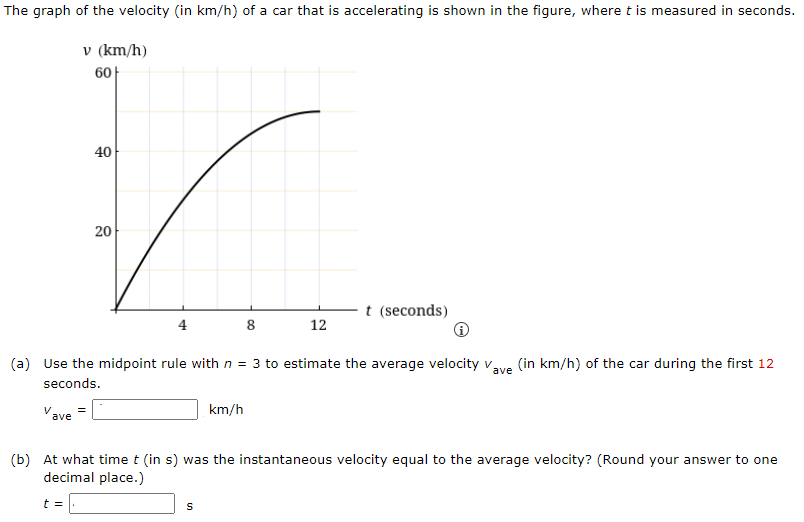
The graph of the velocity (in km/h) of a car that is accelerating is shown in the figure, where t is measured in seconds. (a) Use the midpoint rule with n = 3 to estimate the average velocity vave (in km/h) of the car during the first 12 seconds. vave = km/h (b) At what time t (in s) was the instantaneous velocity equal to the average velocity? (Round your answer to one decimal place.) t = s

Image text
The graph of the velocity (in k m / h ) of a car that is accelerating is shown in the figure, where t is measured in seconds. (a) Use the midpoint rule with n = 3 to estimate the average velocity v ave (in k m / h ) of the car during the first 12 seconds.
v ave = k m / h
(b) At what time t (in s) was the instantaneous velocity equal to the average velocity? (Round your answer to one decimal place.) t = s

Detailed Answer