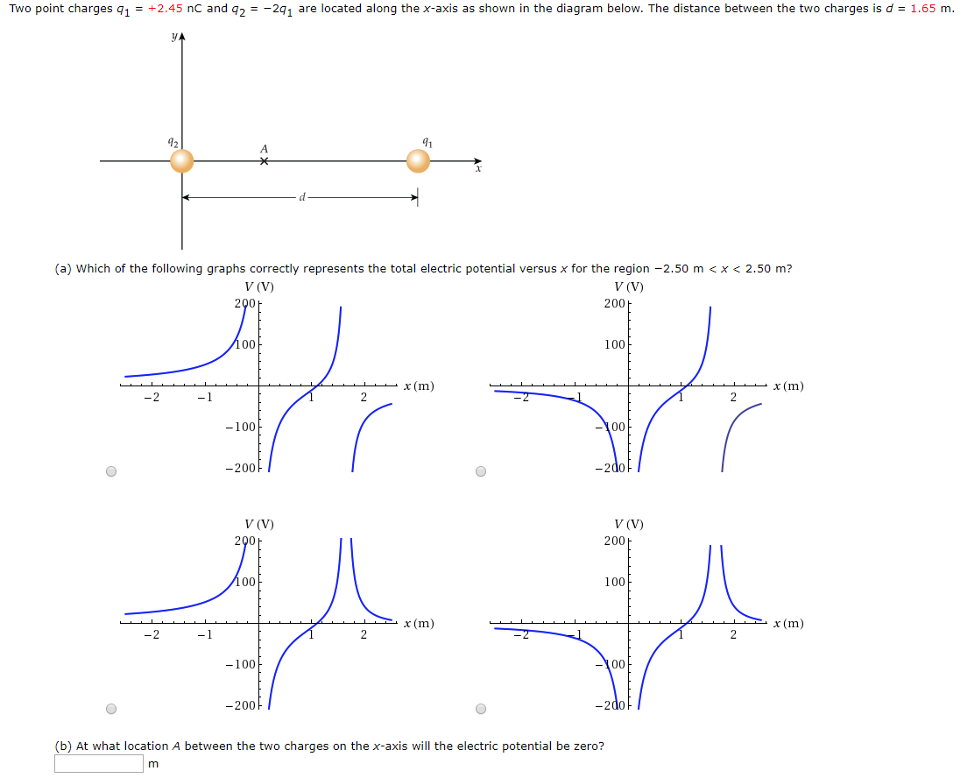
Two point charges q1 = +2.45 nC and q2 = −2q1 are located along the x-axis as shown in the diagram below. The distance between the two charges is d = 1.65 m. (a) Which of the following graphs correctly represents the total electric potential versus x for the region −2.50 m < x < 2.50 m? (b) At what location A between the two charges on the x-axis will the electric potential be zero? m
